How to Get Signals in eCommerce: The Complete Guide

Article written by
Moumita Roy

How to Get Signals in eCommerce: The Complete Guide
In the world of eCommerce, success isn’t just about luck — it’s about paying attention to the signals our business and customers send every day. These signals show up in how shoppers browse our sites, what they buy or leave behind, how the market changes, and what our competitors are doing. Over the years, we’ve learned that understanding these signals is what separates growing businesses from those that struggle to keep up.
Why should we focus on signals? Because data by itself can be overwhelming or confusing. The real advantage comes when we learn to spot meaningful patterns and insights that help us make smarter decisions — whether it’s improving customer experience, adjusting inventory, or fine-tuning our marketing strategies.
In this guide, we’ll explore how to identify, collect, and act on these valuable eCommerce signals. Together, we’ll turn raw data into clear actions that help our businesses grow, stay competitive, and deliver exactly what our customers want.
Understanding eCommerce Signals
Think of eCommerce signals as your business's way of speaking to you. Every click, purchase, abandoned cart, and customer interaction creates a breadcrumb trail that tells a story about what's happening in your store. But here's the thing – not every piece of information deserves your attention.
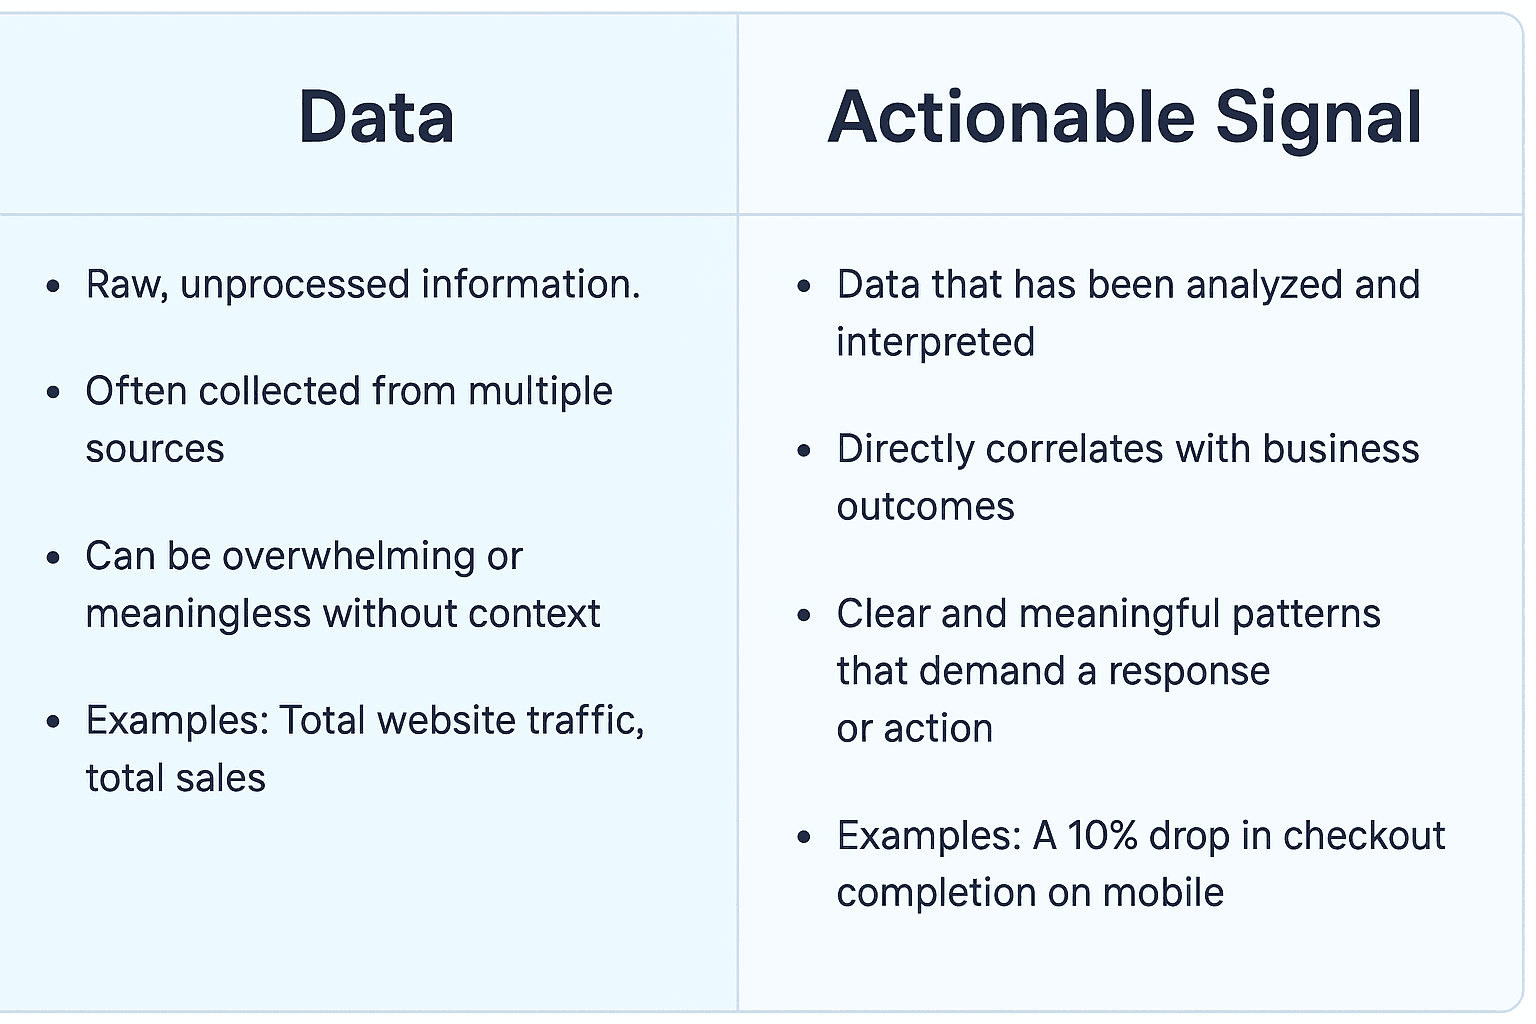
An eCommerce signal is essentially a meaningful change or pattern in your business data that indicates something important is happening or about to happen. It's the difference between knowing your traffic increased by 15% (just data) and understanding that this spike came from mobile users in a specific geographic region who are abandoning their carts at checkout (actionable signal).
Signal vs. Noise: Separating What Matters
Every eCommerce business generates massive amounts of data daily, but most of it is noise – random fluctuations, one-off events, or metrics that don't connect to business outcomes. The art lies in developing filters to separate meaningful signals from background static.
Consistency Over Time:
Real signals tend to persist or show clear patterns. If your mobile conversion rate drops for one day, it might be noise. If it drops for five consecutive days, that's a signal demanding attention.
Statistical Significance:
Small changes often represent normal variation rather than meaningful shifts. A 2% change in any metric probably isn't worth immediate action, but a 20% change definitely warrants investigation.
Business Impact Correlation:
The strongest signals directly tie to business outcomes that matter. A 50% increase in social media followers might feel good, but if it doesn't correlate with sales, brand awareness, or customer engagement, it's likely noise.
Multiple Data Point Validation:
Genuine signals often appear across multiple metrics simultaneously. When cart abandonment rates increase, you might also see longer checkout times, more customer service inquiries, or decreased customer satisfaction scores.
Seasonal and Historical Context:
Understanding your business cycles helps distinguish between normal patterns and genuine anomalies. A 30% sales spike in November for a retail business isn't necessarily a signal – it's probably just Black Friday approaching.
The most successful eCommerce businesses develop what could be called "signal intuition" – the ability to quickly identify which changes deserve immediate attention and which can be monitored passively. This skill comes from combining analytical rigor with deep business knowledge and, frankly, experience making both good and bad decisions based on incomplete information.
The goal isn't to capture every possible signal, but to build a system that reliably identifies the signals that matter most for your specific business model, customer base, and growth stage. Quality always trumps quantity when it comes to signal detection.
Different Types of Signals
Customer behavior signals are like having a direct line into your customers' minds. Every click, scroll, pause, and purchase decision creates a breadcrumb trail that reveals not just what customers are doing, but what they're thinking and feeling. The businesses that master reading these signals gain an almost unfair advantage in predicting and influencing customer actions.
Bounce Rate Beyond the Surface Bounce rate gets talked about constantly, but most people misunderstand what it's actually signaling. A high bounce rate isn't automatically bad – it depends entirely on context. If someone lands on your product page from a Google search and immediately bounces, that's concerning. But if they land on a blog post, read the entire article, and leave satisfied, that bounce actually represents successful content engagement.
The real signal comes from segmented bounce rate analysis. Compare bounce rates across traffic sources, device types, and customer segments. New visitors bouncing at 70% might be normal, but returning customers bouncing at that rate signals a serious problem with site experience or product-market fit.
Scroll Depth: The Attention Map Scroll depth data reveals how compelling your content actually is versus how compelling you think it is. If 80% of visitors never scroll past your hero section, that's a clear signal that your opening content isn't engaging enough to pull people deeper into your site.
The most actionable scroll depth signals come from page-specific analysis. Product pages with low scroll depth might indicate that key information is buried too deep. Blog posts with high scroll depth but low conversion might signal that your call-to-action placement needs adjustment.
Purchase Pattern Signals: The Rhythm of Revenue
Purchase Frequency: Customer Lifecycle Insights Purchase frequency patterns reveal customer segment characteristics and business health indicators that influence everything from inventory planning to marketing budget allocation. Customers who purchase monthly versus quarterly have completely different needs, price sensitivities, and communication preferences.
Changes in purchase frequency often signal shifting customer satisfaction, competitive pressure, or market conditions. When your average customer purchase frequency drops from every 45 days to every 60 days, that's an early warning signal that requires investigation before it impacts revenue.
Purchase Timing: When Matters Purchase timing data reveals customer behavior patterns that can optimize everything from email campaigns to inventory management. Some customers consistently purchase on weekends, others during lunch breaks, and others late at night. These patterns often correlate with customer demographics and can inform personalization strategies.
Seasonal timing patterns create powerful forecasting signals. But the real insight comes from identifying micro-patterns within broader trends. Understanding that your Black Friday sales actually peak at 2 PM rather than midnight can significantly impact promotional timing and inventory allocation.
Search and Navigation Signals: Customer Intent Decoded
Internal Search Behavior What customers search for on your site reveals gaps between what they expect to find and what you're presenting. High-volume searches that return poor results signal content or product gaps. Searches that don't convert signal potential pricing, presentation, or product-market fit issues.
Search refinement patterns provide particularly valuable signals. When customers search for "blue dress," then refine to "blue summer dress," then "blue summer dress under $50," they're telling you exactly what product attributes and price points matter most to them.
Navigation Pattern Analysis Customer navigation patterns reveal how intuitive your site structure actually is versus how logical it seems to you. Customers who consistently use your search function instead of category navigation might be signaling that your product organization doesn't match their mental models.
Heat maps of navigation usage often reveal surprising insights. Categories that seem important based on product volume might get ignored, while seemingly minor categories generate disproportionate engagement. These patterns signal opportunities for site structure optimization and marketing focus adjustments.
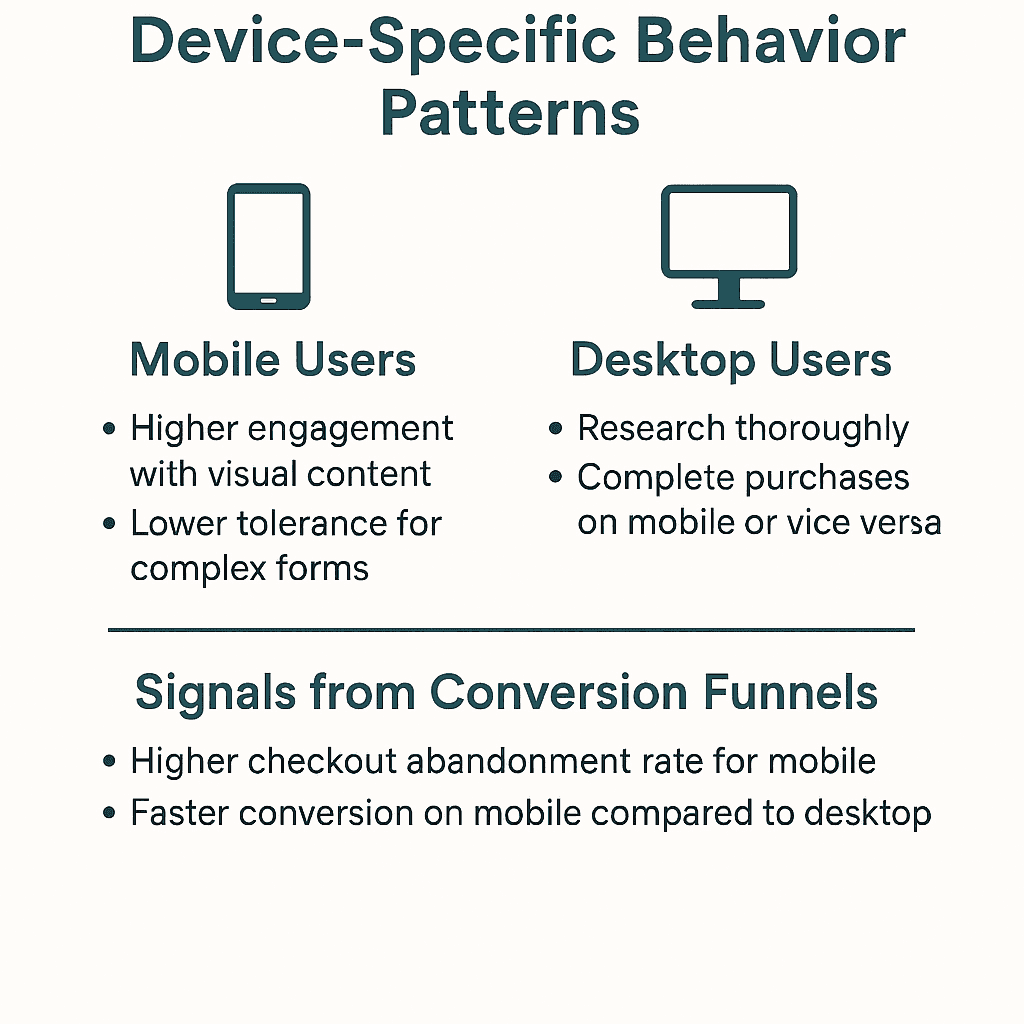
Mobile vs. Desktop: The Tale of Two Experiences
Cross-Device Journey Tracking Cross-device behavior creates some of the most valuable customer journey signals. Customers who research on desktop but purchase on mobile represent different marketing attribution needs than those who follow the reverse pattern. Understanding these patterns helps optimize marketing spend allocation and creative messaging across channels.
Marketing Performance Signals
Marketing signals separate successful campaigns from expensive experiments. Unlike customer behavior signals that tell you what's happening, marketing performance signals reveal whether your efforts to influence customer behavior are actually working – and more importantly, whether they're generating profitable results.
Engagement Quality Metrics Click-through rates and impressions tell you whether people notice your ads, but engagement quality metrics reveal whether they're the right people with genuine purchase intent. Time spent on site after clicking an ad, pages per session, and bounce rate from different campaigns signal audience quality and message-market fit.
The most valuable campaign signals come from post-click behavior analysis. Two campaigns might generate identical click-through rates, but if one produces visitors who browse three pages and the other produces visitors who immediately bounce, they're targeting completely different audience segments with very different commercial potential.
Conversion Funnel Performance Campaign-specific conversion funnel analysis reveals where different traffic sources succeed and fail. Some channels might excel at generating awareness but struggle with conversion, while others might produce lower volume but higher-quality traffic that converts readily.
Multi-touch attribution signals show how different campaigns work together rather than competing. Display ads might rarely get last-click attribution but consistently appear in the customer journey before higher-converting search clicks. Understanding these interaction effects prevents cutting campaigns that actually contribute to overall performance.
Channel Attribution Signals: Credit Where Credit's Due
Assisted Conversion Analysis Channels that rarely get conversion credit but frequently appear in successful customer journeys provide crucial supporting value that traditional attribution models miss. Display advertising, content marketing, and social media often fall into this category, generating signals about brand building and awareness effects.
The signal strength comes from correlation analysis between assisted conversions and overall marketing performance. Periods with higher assisted conversion rates often precede periods with better overall conversion performance, suggesting that supporting channels create conditions for closing channels to succeed.
Customer Acquisition Cost Trends: The Economics of Growth
CAC by Channel Evolution Customer acquisition cost trends reveal the sustainability and scalability of different marketing channels. Gradually increasing CAC might signal market saturation or increased competition, while sudden CAC spikes often indicate campaign optimization issues or external market changes.
The most actionable CAC signals come from segmented analysis. CAC for new customers versus returning customers, different geographic regions, or various customer segments can reveal optimization opportunities and budget reallocation needs that blended CAC metrics miss entirely.
Lifetime Value to CAC Ratios LTV:CAC ratios signal the long-term profitability of customer acquisition efforts. But static ratios don't tell the full story – trending ratios reveal whether your marketing becomes more or less efficient over time. Declining LTV:CAC ratios might signal customer quality issues, retention problems, or the need for acquisition strategy adjustments.
Cohort-based LTV:CAC analysis provides even stronger signals. If customers acquired through certain channels or during specific time periods show different lifetime value patterns, it indicates opportunities for channel optimization or seasonal budget adjustments.
Return on Ad Spend Fluctuations: Revenue Reality Check
ROAS Trend Analysis ROAS fluctuations signal campaign performance changes, market condition shifts, or competitive pressure variations. Gradual ROAS decline might indicate market saturation, while sudden drops often point to specific campaign issues or external factors like competitor promotions.
The key insight comes from analyzing ROAS across different time horizons. Some campaigns show strong immediate ROAS but weak long-term performance, while others show the opposite pattern. Understanding these timing differences helps optimize both campaign tactics and budget allocation timing.
Seasonal ROAS Patterns Year-over-year ROAS comparisons reveal whether performance changes represent normal seasonal variation or genuine performance shifts. If this year's holiday ROAS significantly underperforms last year's, it signals competitive, market, or execution issues that require investigation.
Daily and weekly ROAS patterns within campaigns can signal optimization opportunities. If certain days consistently show higher ROAS, it might indicate audience behavior patterns that could inform broader campaign timing and budget allocation strategies.
Product Performance Indicators: What Customers Really Want
Cross-Sell and Bundle Analysis Products frequently purchased together signal customer needs and optimization opportunities. When customers consistently buy specific combinations, it indicates natural product relationships that can inform inventory planning, promotional bundling, and website merchandising.
Changes in cross-sell patterns often signal shifting customer behavior or market conditions. If a previously popular product combination suddenly stops performing, it might indicate competitive pressure, seasonal changes, or product quality issues affecting one item in the bundle.
Seasonal Demand Patterns: Timing the Market
Year-over-Year Trend Analysis Seasonal patterns create predictable signals, but year-over-year comparisons reveal whether current performance represents normal variation or genuine trend shifts. If this year's back-to-school season underperforms last year's by 20%, it signals market, competitive, or execution changes requiring investigation.
Micro-seasonal patterns within broader trends provide competitive advantages. Understanding that your audience starts holiday shopping exactly 47 days before Christmas rather than following general retail patterns helps optimize inventory, marketing, and promotional timing.
Weather and External Factor Correlations Weather patterns create demand signals for many product categories beyond obvious seasonal items. Unseasonably warm weather might signal reduced demand for comfort food items or increased demand for outdoor products. These correlations help predict demand fluctuations and optimize inventory levels.
Economic indicators often correlate with seasonal pattern changes. During economic uncertainty, customers might delay seasonal purchases or trade down to lower-priced alternatives. Understanding these correlations helps adjust seasonal forecasting and inventory planning.
Price Sensitivity Signals: Finding the Sweet Spot
Elasticity Testing Results Price elasticity signals reveal how demand responds to price changes across different products, customer segments, and market conditions. Products with low price elasticity can support higher margins, while high elasticity products might benefit from volume-based pricing strategies.
The most valuable price sensitivity signals come from dynamic testing rather than static analysis. Customer response to price changes during different market conditions, seasonal periods, or competitive situations reveals optimal pricing strategies for various scenarios.
Promotional Response Patterns Customer response to different promotional types signals price sensitivity and purchase motivation patterns. Some customers respond strongly to percentage discounts, others to dollar-amount discounts, and others to free shipping offers. Understanding these preferences helps optimize promotional strategies and margin management.
Promotional cannibalization signals reveal whether discounts generate incremental sales or simply accelerate purchases that would happen anyway. If sales return to normal immediately after promotions end, it might signal that discounts are reducing margin without generating additional demand.
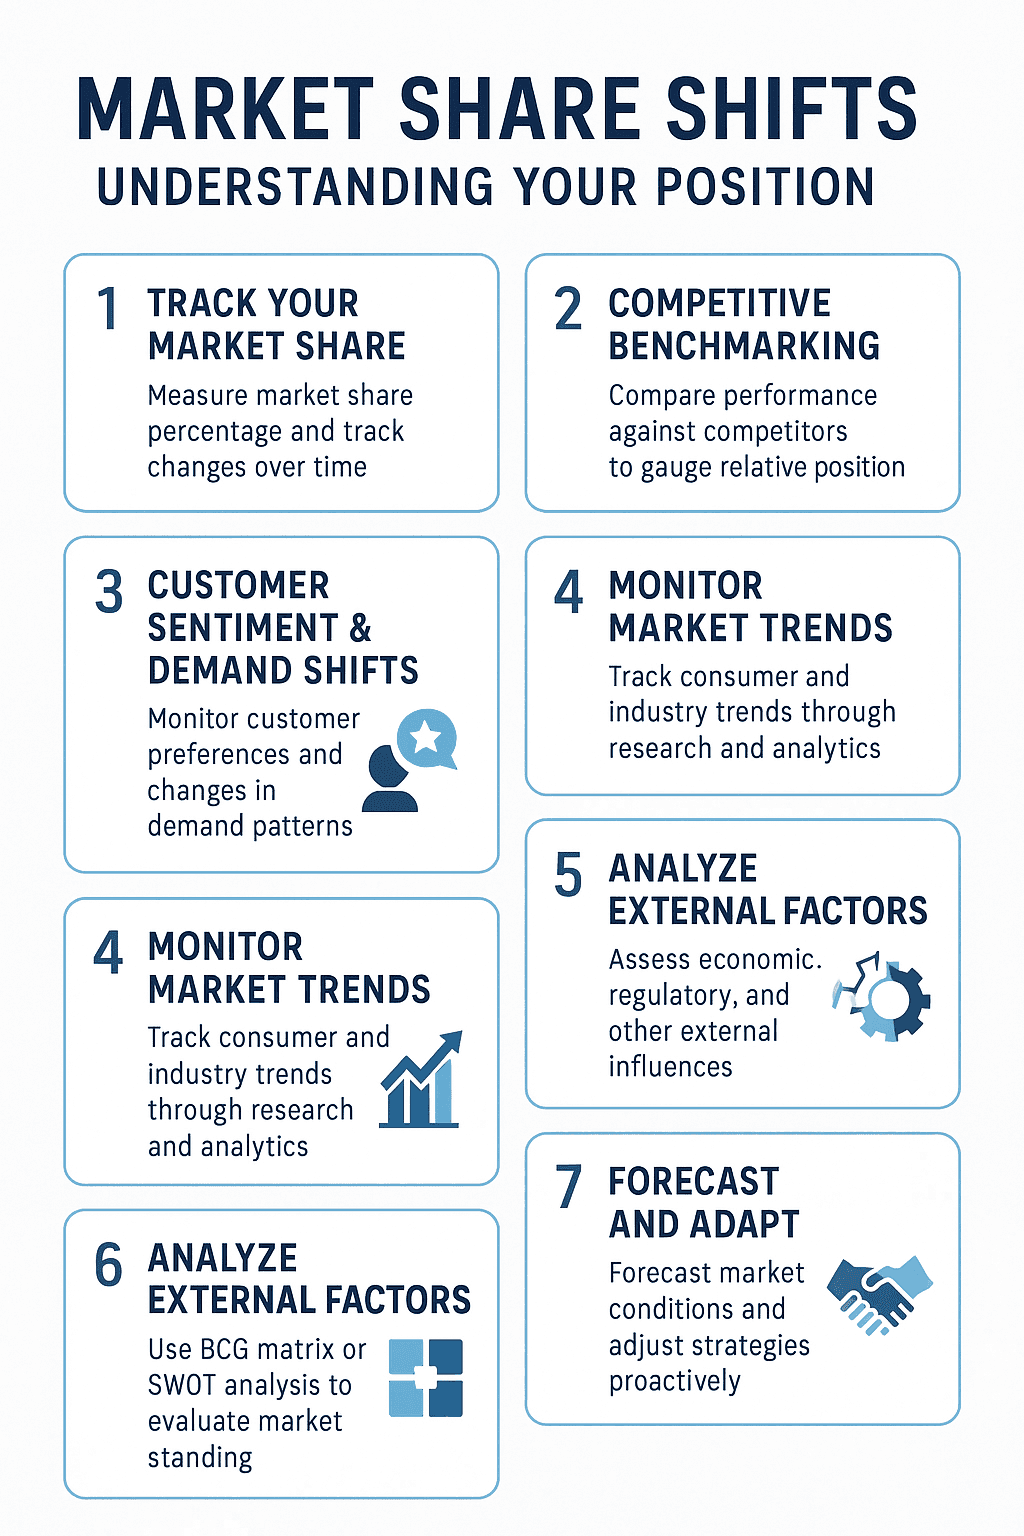
Market Share Shifts: Understanding Your Position
Relative Performance Indicators Market share signals reveal whether performance changes represent company-specific issues or broader market trends. If your traffic declines 10% while competitors decline 20%, you're actually gaining relative market position despite absolute performance decreases.
Search visibility comparisons provide measurable market share signals. Rankings for important keywords, search result features, and branded search volume relative to competitors indicate market position trends that often predict future sales performance.
Category Growth vs. Company Growth Understanding whether you're growing faster or slower than your product categories reveals competitive positioning strength. Growing 15% in a category that's growing 30% signals competitive disadvantage, while growing 15% in a declining category indicates strong competitive performance.
Brand mention volume and sentiment compared to competitors creates relative positioning signals. Increasing brand mentions while competitor mentions decline suggests successful marketing or product strategies worth doubling down on.
Competitor Pricing Changes: Market Dynamics
Price Position Monitoring Competitor pricing signals reveal market conditions, competitive pressure, and optimization opportunities. When multiple competitors simultaneously increase prices, it might signal industry-wide cost pressures or market consolidation that creates pricing power opportunities.
Dynamic pricing response signals show how quickly competitors react to your pricing changes. Fast competitive response indicates strong monitoring and potentially aggressive competitive positioning. Slow response might indicate opportunities for rapid market share gains through strategic pricing.
Promotional Pattern Analysis Competitor promotional timing and frequency create market rhythm signals that affect customer expectations and purchase timing. If competitors consistently promote on the same schedule, breaking that pattern might capture disproportionate customer attention and sales.
Promotional intensity signals reveal competitive desperation or confidence. Increasing promotional frequency might indicate inventory clearance needs or market share defense, while decreasing promotions might signal supply constraints or margin improvement focus.
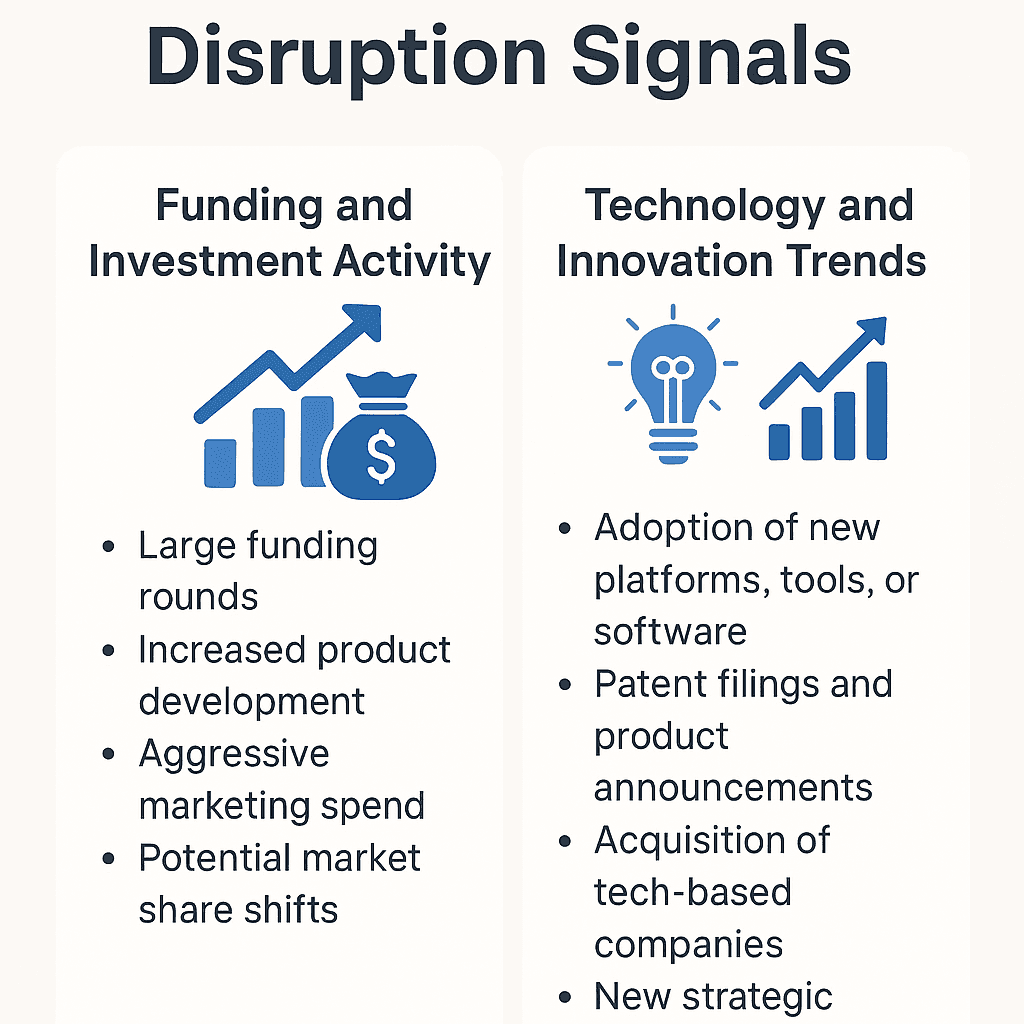
Industry Trend Indicators: The Broader Context
Regulatory and Legal Changes Industry regulation changes create compliance requirements and competitive advantage opportunities. Early awareness of regulatory trends helps prepare for requirements while potentially creating barriers for less prepared competitors.
Legal precedents in your industry signal risk factors and opportunity areas that might affect business strategy. Privacy regulations, advertising restrictions, or consumer protection changes often create both challenges and competitive differentiation opportunities.
Technology Adoption Patterns Industry technology adoption rates signal competitive requirements and customer expectation changes. Understanding whether your market adopts new technologies quickly or slowly helps time investments and capability development.
Consumer behavior trend indicators reveal shifting expectations that affect competitive positioning requirements. Changes in payment preferences, shipping expectations, or communication channel preferences create both challenges and opportunities for competitive advantage.
Technical and Operational Signals
Technical signals often provide the earliest warning system for issues that will eventually impact customer experience and business performance. Unlike other signals that might take days or weeks to manifest in business metrics, technical signals can predict problems hours or minutes before they affect customers.
Page Load Speed Variations Page load speed signals go far beyond simple site speed metrics. Load time variations across different pages, devices, and geographic regions reveal optimization opportunities and potential customer experience issues. A product page that loads quickly on desktop but slowly on mobile creates conversion barriers that speed averages might hide.
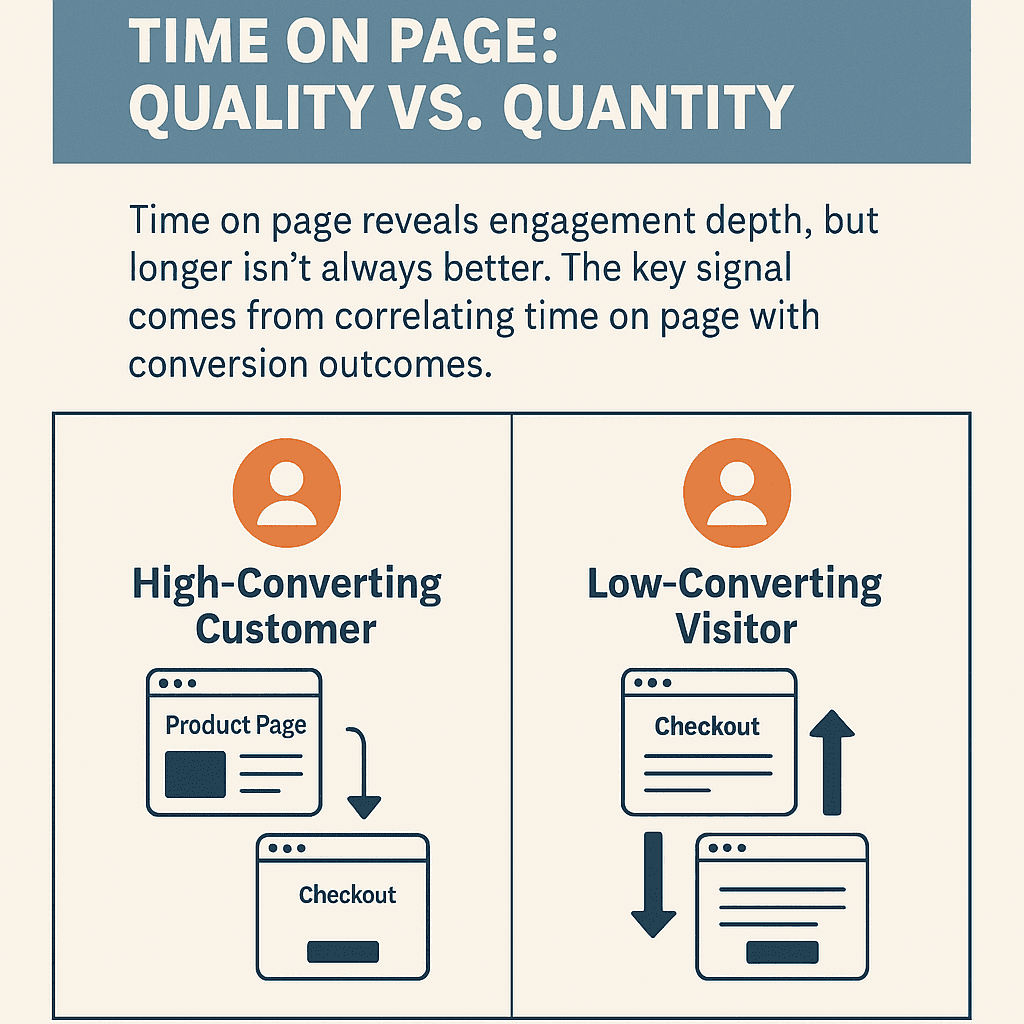
The most actionable speed signals come from correlating load times with conversion rates across different customer segments. If mobile users abandon at twice the rate when page load times exceed three seconds, that's a clear signal about mobile optimization priorities and revenue impact.
Server Response Time Patterns Server response time fluctuations signal capacity issues, technical problems, or traffic pattern changes before they create customer experience problems. Gradual response time increases might indicate growing traffic that will eventually overwhelm current infrastructure.
Geographic response time variations signal content delivery optimization opportunities. If customers in certain regions consistently experience slower response times, it might indicate the need for additional server locations or CDN optimization.
Checkout Process Bottlenecks: Where Revenue Gets Lost
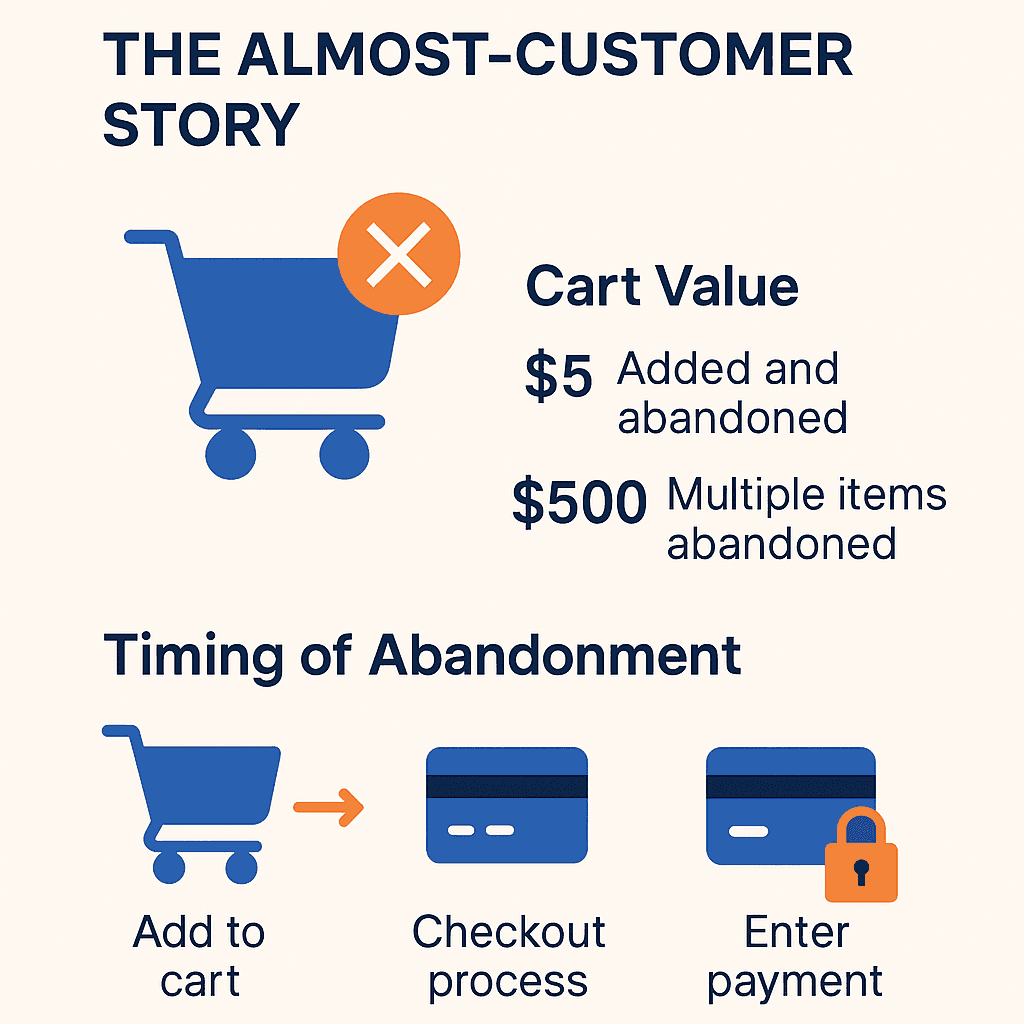
Form Abandonment Analysis Checkout form abandonment signals reveal specific friction points in the purchase process. High abandonment at the shipping information step might indicate form complexity issues, while abandonment at payment information suggests security concerns or payment option limitations.
Field-level analytics provide granular signals about checkout optimization opportunities. If customers consistently abandon after encountering specific form fields, it signals opportunities for form simplification, better explanation, or alternative approaches.
Payment Method Performance Payment processing signals reveal customer preference trends and technical issues. Increasing usage of specific payment methods might signal demographic shifts or convenience preferences worth accommodating. Payment failure rate increases often signal technical issues requiring immediate attention.
Cross-border payment performance creates signals about international expansion readiness and optimization needs. High failure rates for international payments might indicate currency, regulatory, or technical barriers limiting market expansion opportunities.
Payment Processing Issues: Revenue Protection
Transaction Success Rates Payment processing success rate fluctuations signal technical issues, fraud prevention problems, or customer behavior changes. Sudden decreases in success rates often indicate payment gateway issues, while gradual decreases might signal increasing fraud attempts or customer payment method changes.
The timing of payment failures creates specific signals about root causes. Failures concentrated during high-traffic periods might indicate capacity issues, while failures spread evenly might indicate broader technical or policy problems.
Fraud Detection Effectiveness Fraud detection signals balance security with customer experience. Increasing false positive rates might indicate overly aggressive fraud detection that's blocking legitimate customers. Increasing fraud attempts might signal the need for enhanced detection capabilities.
Geographic fraud patterns create signals about market risks and opportunity assessment. High fraud rates from specific regions might indicate market entry challenges, while low fraud rates might signal market expansion opportunities.
Tools and Technologies to Capture and Analyze Signals
The difference between successful and struggling eCommerce businesses often comes down to their ability to capture, analyze, and act on signals faster than their competitors. But here's the reality: having the right tools is only half the battle. The other half is knowing how to configure, integrate, and interpret the data these tools provide.
Google Analytics: The Foundation Layer
Google Analytics remains the cornerstone of most eCommerce signal detection systems. Enhanced eCommerce tracking, custom goals, and audience segmentation transform GA from a basic traffic counter into a sophisticated customer behavior analysis platform. The most valuable setup involves creating custom segments for high-value customers and configuring attribution models that reflect your marketing reality.
Hotjar and User Experience Tools
Hotjar, FullStory, and LogRocket bridge the gap between quantitative analytics and qualitative customer understanding. Heatmaps show where customers click and scroll, while session recordings reveal customer struggles. The signal detection power comes from combining this data with analytics - if GA shows high cart abandonment, Hotjar recordings reveal whether it's due to confusing forms or unexpected costs.
SEMrush and Competitive Intelligence Platforms
SEMrush, Ahrefs, and SimilarWeb provide competitive intelligence signals that put your performance in market context. These tools reveal competitor strategies and help separate company-specific issues from market-wide trends. If your traffic drops 10% but competitors drop 20%, you're actually gaining market share.
Customer Feedback and Survey Tools
Typeform, SurveyMonkey, and embedded feedback widgets capture direct customer insights that quantitative tools miss. Post-purchase surveys, exit intent surveys, and NPS tracking provide structured feedback that's easier to analyze than random customer service inquiries.
Data Integration and Alerting
Tools like Zapier, Segment, and custom APIs connect disparate data sources into unified signal detection systems. The goal is creating trigger-based alerts rather than passive dashboards. When cart abandonment spikes, automated systems immediately alert teams and potentially trigger recovery campaigns.
Dashboard Design and Visualization
Effective dashboards prioritize actionability over comprehensiveness, answering: What needs attention now? What trends require monitoring? What's performing better or worse than expected? Visual hierarchy through color coding and positioning directs attention to the most important signals without overwhelming users.
Acting on Signals: Best Practices
Here's the reality about signal detection: knowing what's happening in your business is only half the battle. The real competitive advantage comes from how quickly and effectively you can turn those insights into profitable actions. The best eCommerce businesses have turned signal response into a finely-tuned competitive weapon.
Emergency Response Protocols
Some signals can't wait for your Monday morning team meeting. When your conversion rate drops 20% in an hour, your checkout process crashes, or fraudulent transactions spike dramatically, every minute of delay costs real money and customer trust.
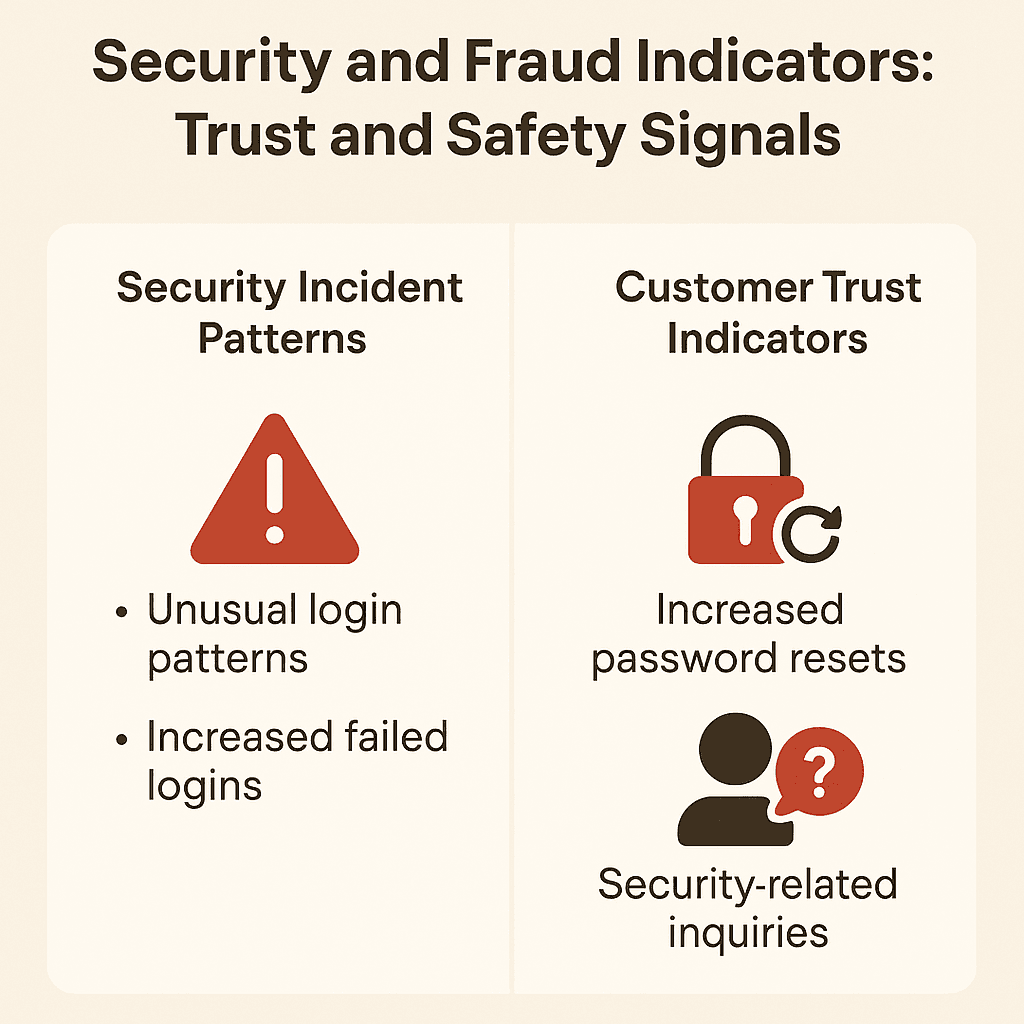
Create a signal triage system that separates true emergencies from everything else. Revenue threats like sudden conversion drops, payment failures, or your bestselling products going out of stock get the red alert treatment. Customer experience disasters like site crashes or widespread shipping problems need immediate technical response. Security incidents require their own specialized protocols that you hopefully never need to use.
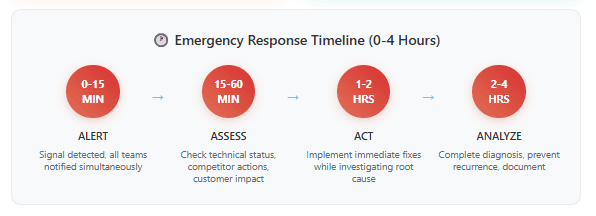
Think of it like a hospital emergency room - you need protocols that enable fast action without waiting for complete diagnosis. If your conversion rates crater, you immediately check technical performance, competitive pricing, and customer service queues while simultaneously starting deeper analysis. Speed matters more than perfection when revenue is bleeding.
Tactical Response Timelines
Most signals aren't emergencies, but they still deserve systematic attention within 24-48 hours. These include marketing performance changes, competitive moves, or customer behavior shifts that suggest optimization opportunities rather than immediate crises.
Set up daily signal review meetings where your team evaluates non-emergency signals using consistent criteria. How strong is the signal? What's the potential impact? How difficult would it be to address? This systematic approach prevents both overreacting to minor blips and ignoring genuine opportunities.
The sweet spot for tactical responses balances urgency with thoroughness. If your email campaign performance drops significantly, you want to check data accuracy, analyze segment performance, assess deliverability, and review competitive landscape within 24 hours. Then implement optimizations within 48 hours. Fast enough to matter, thorough enough to avoid mistakes.
Statistical Rigor Standards
Nobody wants to make major business changes based on statistical noise, but you also can't wait six months for perfect statistical certainty. The trick is matching your confidence requirements to the stakes involved.
Use 95% confidence levels for revenue-impacting changes that could seriously hurt your business if you're wrong. Marketing optimization tests might only need 90% confidence since you can quickly reverse course if needed. Customer experience improvements often work with 85% confidence when you combine statistical data with qualitative feedback.
High-traffic businesses can achieve statistical significance in days, while smaller companies might need weeks or alternative validation methods. Create minimum viable test frameworks that give you sufficient confidence within reasonable timeframes. Sometimes a well-designed customer survey provides better insights than waiting months for statistical significance on low-traffic metrics.
Multi-Variable Testing Approaches
Real business situations often involve multiple interacting factors. If signals suggest both pricing sensitivity and checkout friction, you don't want to spend months testing each factor separately when you could test them together and understand how they interact.
Factorial testing designs let you evaluate multiple changes simultaneously. Test price changes and checkout improvements together to see if the combination works better than either change alone. This approach reveals optimization opportunities that sequential testing would miss while reducing your overall testing time.
Just remember that multi-variable testing requires more sophisticated statistical analysis. Use proper statistical software and make sure your team understands how to interpret interaction effects. The last thing you want is to implement changes based on statistical misunderstanding.
Qualitative Validation Integration
Numbers tell you what happened, but customer conversations tell you why it happened and whether it's likely to continue. Combine quantitative signals with customer interviews to get the full picture.
If conversion rate improvements result from pricing changes, customer interviews reveal whether those changes affect brand perception or purchase motivations in ways that might hurt long-term relationships. If checkout optimizations increase conversions, user testing shows whether the improvements actually reduce friction or just hide it elsewhere in the process.
The most successful businesses use quantitative results to identify what to investigate, then use qualitative research to understand whether the changes will work long-term under different conditions.
Implementation Rollout Strategies
Finding something that works in a test is exciting, but scaling it successfully requires careful planning. Not everything that works for one customer segment will work for another, and not everything that works under current conditions will work when market conditions change.
Start with phased rollouts that gradually expand successful interventions while watching for problems. Begin with customer segments most similar to your test conditions, then expand to additional segments while monitoring key metrics. This catches potential issues before full implementation while capturing benefits quickly.
Consider the full implementation picture: technical infrastructure capacity, team training requirements, customer communication needs. Create scaling checklists that ensure you've thought through all requirements before expansion. Technical optimizations might need server upgrades. Process improvements might require staff training and customer notifications.
False Positive Analysis
Every signal that seemed important but turned out to be noise teaches you something valuable about improving your signal detection accuracy. The key is analyzing these systematically rather than just forgetting about them.
Categorize different types of false positives to identify patterns. Technical false positives might result from measurement errors or data quality issues. Interpretation false positives might come from insufficient context or mistaking correlation for causation. Market false positives might happen when external factors invalidate your assumptions.
Create a false positive database that documents signal characteristics, what actions you took, actual outcomes, and lessons learned. This institutional knowledge helps teams recognize similar situations and avoid repeated mistakes. It's like building an immune system for your signal detection process.
Signal Refinement Processes
Learning from false positives enables continuous improvement of your signal detection thresholds, alert criteria, and response protocols. Quarterly signal system reviews analyze false positive rates, successful identification accuracy, and response effectiveness.
Use this analysis to adjust alert thresholds, modify signal scoring algorithms, and update response procedures. Signal detection systems need to evolve as your business grows and market conditions change. What worked as a startup might not work as a scale-up.
The goal isn't eliminating all false positives - that would make your system so conservative it would miss real opportunities. The goal is optimizing the balance between catching genuine signals and avoiding noise.
Team Learning Integration
False positive experiences provide excellent training opportunities that improve team signal interpretation skills. Regular review sessions analyzing what led to incorrect interpretations help build collective expertise.
Document decision-making frameworks that capture team wisdom about signal interpretation and response strategies. This creates organizational intelligence that doesn't depend on individual knowledge and enables consistent decision-making across different team members.
The most sophisticated businesses develop signal interpretation capabilities that improve over time, making their competitive advantages stronger and more sustainable.
Advanced Signal Strategies
Once you've mastered basic signal detection and response, you can develop sophisticated capabilities that provide sustainable competitive advantages. This is where signal analysis transforms from reactive problem-solving into proactive market positioning.
Customer Behavior Prediction
Instead of just reacting to what customers do, advanced businesses predict what customers will do next. Machine learning models trained on historical behavior can identify patterns that predict churn, lifetime value, and purchase timing with remarkable accuracy.
Build predictive customer models that combine multiple signal types into actionable forecasts. Purchase timing models might incorporate individual buying cycles, inventory levels, seasonal patterns, and promotional schedules to predict exactly when to reach out to each customer. Churn prediction models spot at-risk customers weeks before traditional metrics would show problems.
Start simple with readily available data, then gradually incorporate additional signal types as your modeling capabilities mature. The key is building systems that automatically update as new data comes in and continuously improve prediction accuracy.
Market Trend Forecasting
Social media sentiment, search trends, and early adopter behavior can predict market shifts months before they show up in mainstream sales data. Smart businesses monitor these leading indicators to position themselves ahead of competitive responses.
Monitor early adopter purchase patterns - they often predict broader market trends 6-12 months before mass adoption. Social media conversation analysis can identify emerging needs before they translate into search volume or purchase behavior.
The trick is distinguishing genuine trends from temporary fluctuations. Create trend scoring algorithms that weight different signal types based on their historical accuracy in predicting market changes. This systematic approach enables confident strategic decision-making.
Omnichannel Customer Journey Analysis
Customer behavior across different channels creates interconnected patterns that reveal optimization opportunities invisible in single-channel analysis. Email engagement might predict social media conversion readiness. Social media engagement might indicate customer service needs.
Map cross-channel signal relationships to reveal customer journey patterns. Customers who engage with educational content via email might be more receptive to premium product recommendations on social media. Customers who comparison shop extensively might respond better to personalized email offers than generic campaigns.
This requires unified customer identification and journey tracking capabilities. Implement customer data platforms that connect interactions across channels and enable comprehensive journey analysis. The unified view reveals optimization opportunities that single-channel analysis would miss.
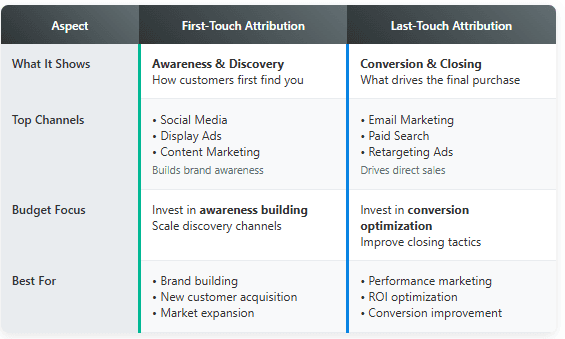
Attribution Model Integration
Traditional last-click attribution often misrepresents the true value of awareness and consideration-stage signals, leading to suboptimal resource allocation. Different businesses need different attribution approaches based on their customer journey patterns.
Develop custom attribution models that reflect your actual customer behavior. B2B businesses might need longer attribution windows for extended consideration periods. Subscription businesses might emphasize first-touch attribution for acquisition while using position-based attribution for retention.
Compare multiple attribution models to understand how different approaches affect signal interpretation and business decisions. This comprehensive view enables more nuanced optimization strategies that account for different touchpoint values.
So, What’s next?
eCommerce success depends on transforming data into actionable intelligence. This guide showed you how to distinguish meaningful signals from noise, implement industry-specific strategies, and avoid common pitfalls.
Signals are data with context and direction. Raw metrics tell you what happened; actionable signals reveal why and what to do about it. Start small and scale systematically. Begin with high-impact, low-complexity signals like conversion rate monitoring and cart abandonment tracking before advancing to predictive modeling.
Choose one Quick Win from our Priority Matrix. Set it up this week. Measure impact in 30 days. Scale to the next signal. The market rewards those who listen to what their business is telling them. Start listening today.
Article written by
Moumita Roy